Rol: Product Design / Strategy Design Category: App mobile iOS & Android Project Type: Logistic / Process Digitization
Designing a mobile tool for counter agents to reduce shipment processing errors by 50% in 90 days
Back to home
Challenge
Counter agents at LATAM Cargo terminals operate in a high pressure, time constrained environment where every shipment requires consulting multiple systems, manually capturing data, and validating information against booking records. This fragmented process generates errors, delays, and operational incidents that directly impact punctuality, cargo integrity, and customer satisfaction.
Hypothesis
Counter agents terminals operate in a high pressure, time constrained environment where every shipment requires consulting multiple systems, manually capturing data, and validating information against booking records. This fragmented process generates errors, delays, and operational incidents that directly impact punctuality, cargo integrity, and customer satisfaction.
Summary
This project focused on designing a mobile application for counter agents, the first physical link in the air cargo delivery chain. The solution unified booking verification, data validation, warehouse location assignment, photo documentation, and client signature collection into a single sequential flow. The design prioritized speed, error prevention, and environmental adaptability to serve agents operating under real terminal conditions.
Problem Users Faced
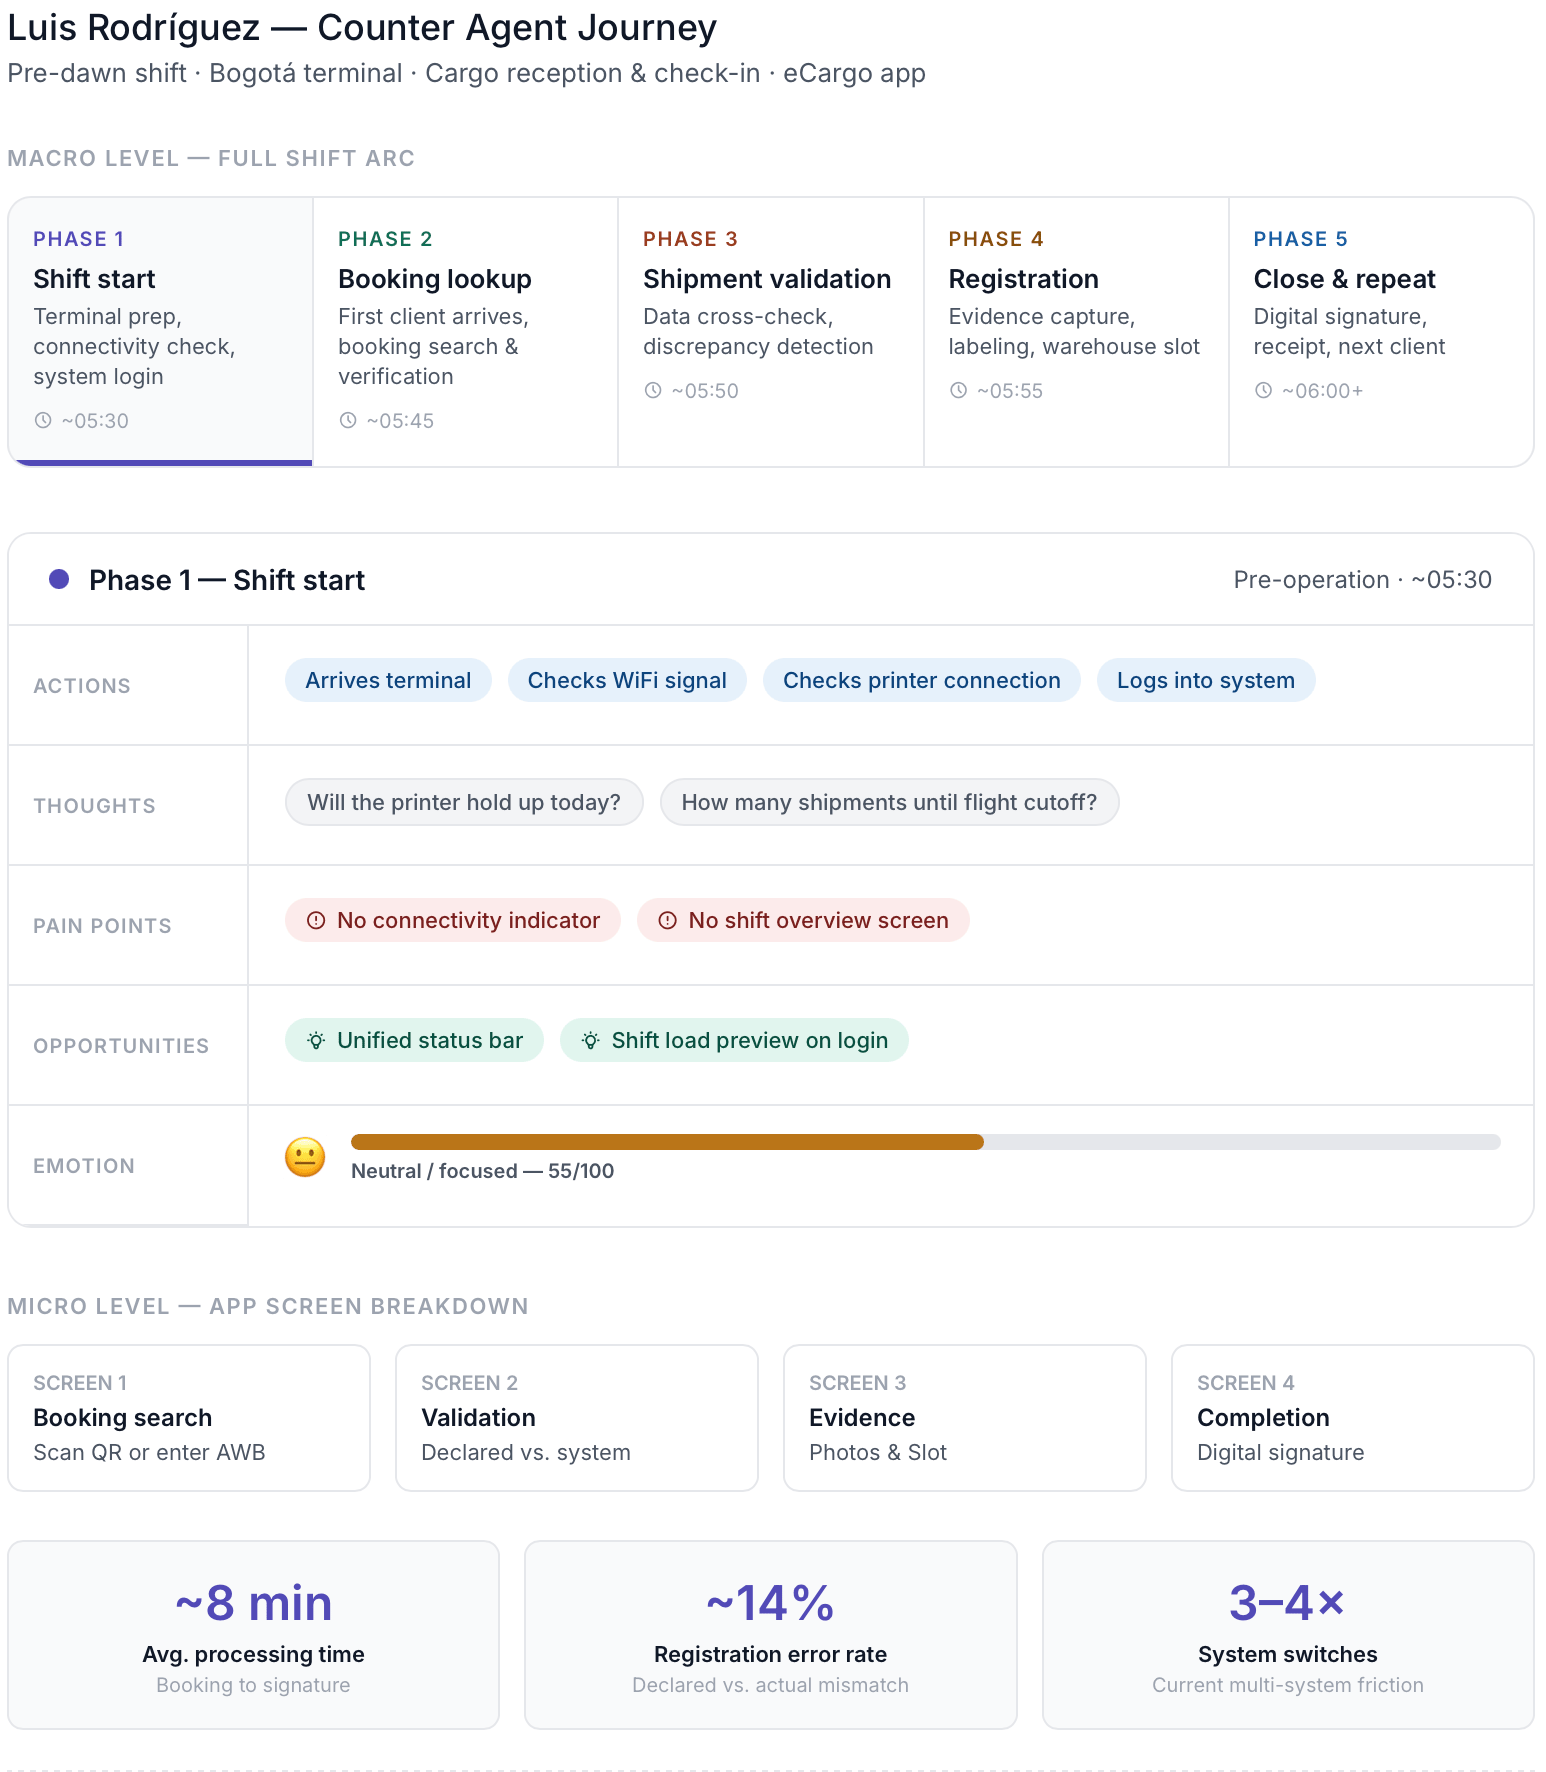
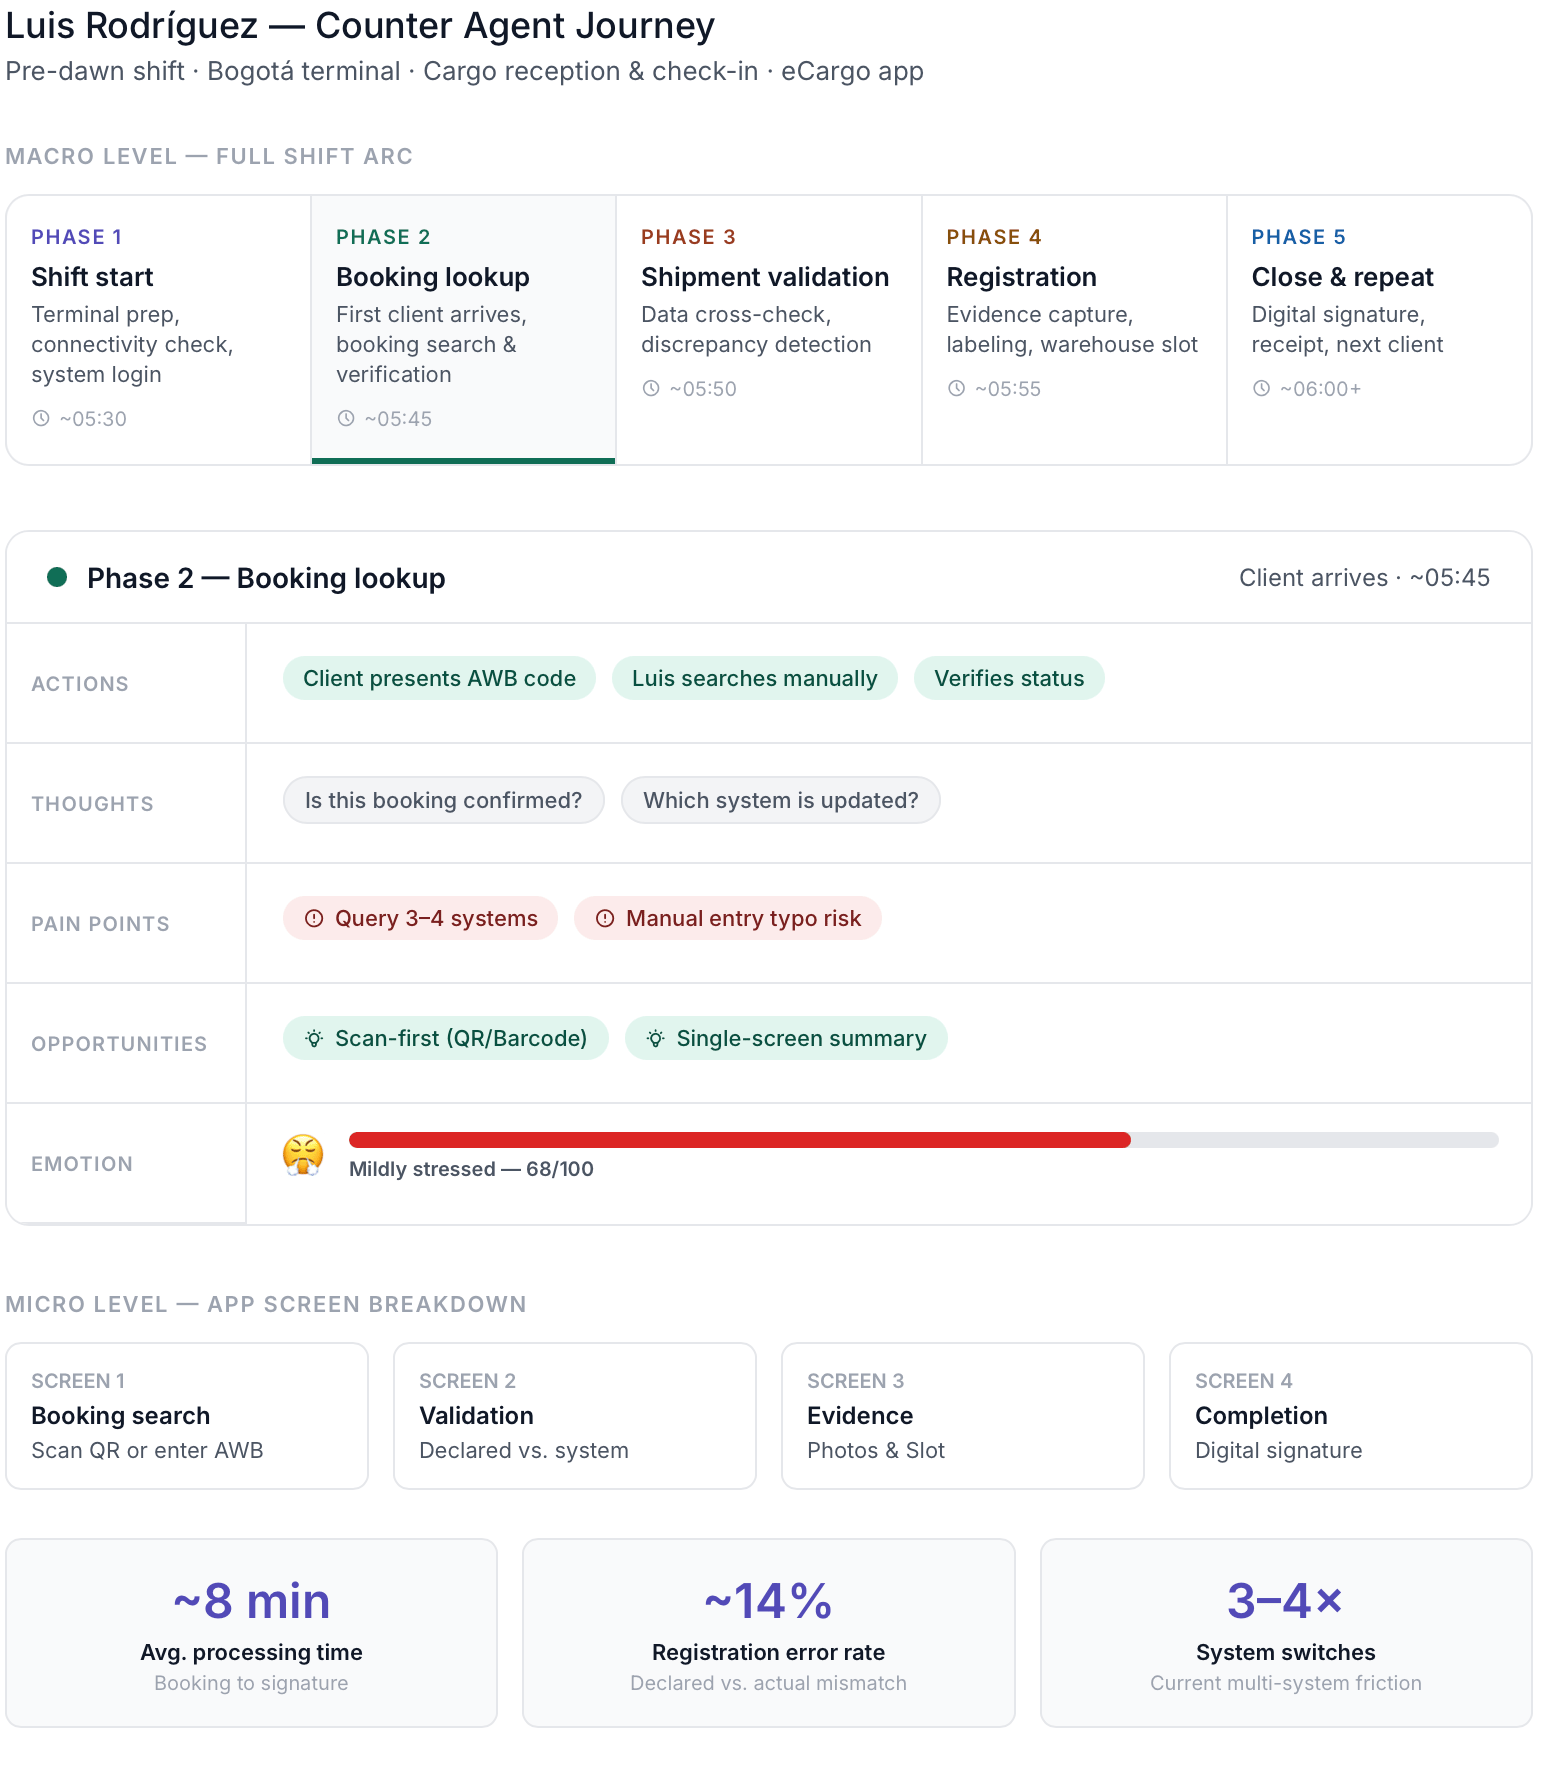
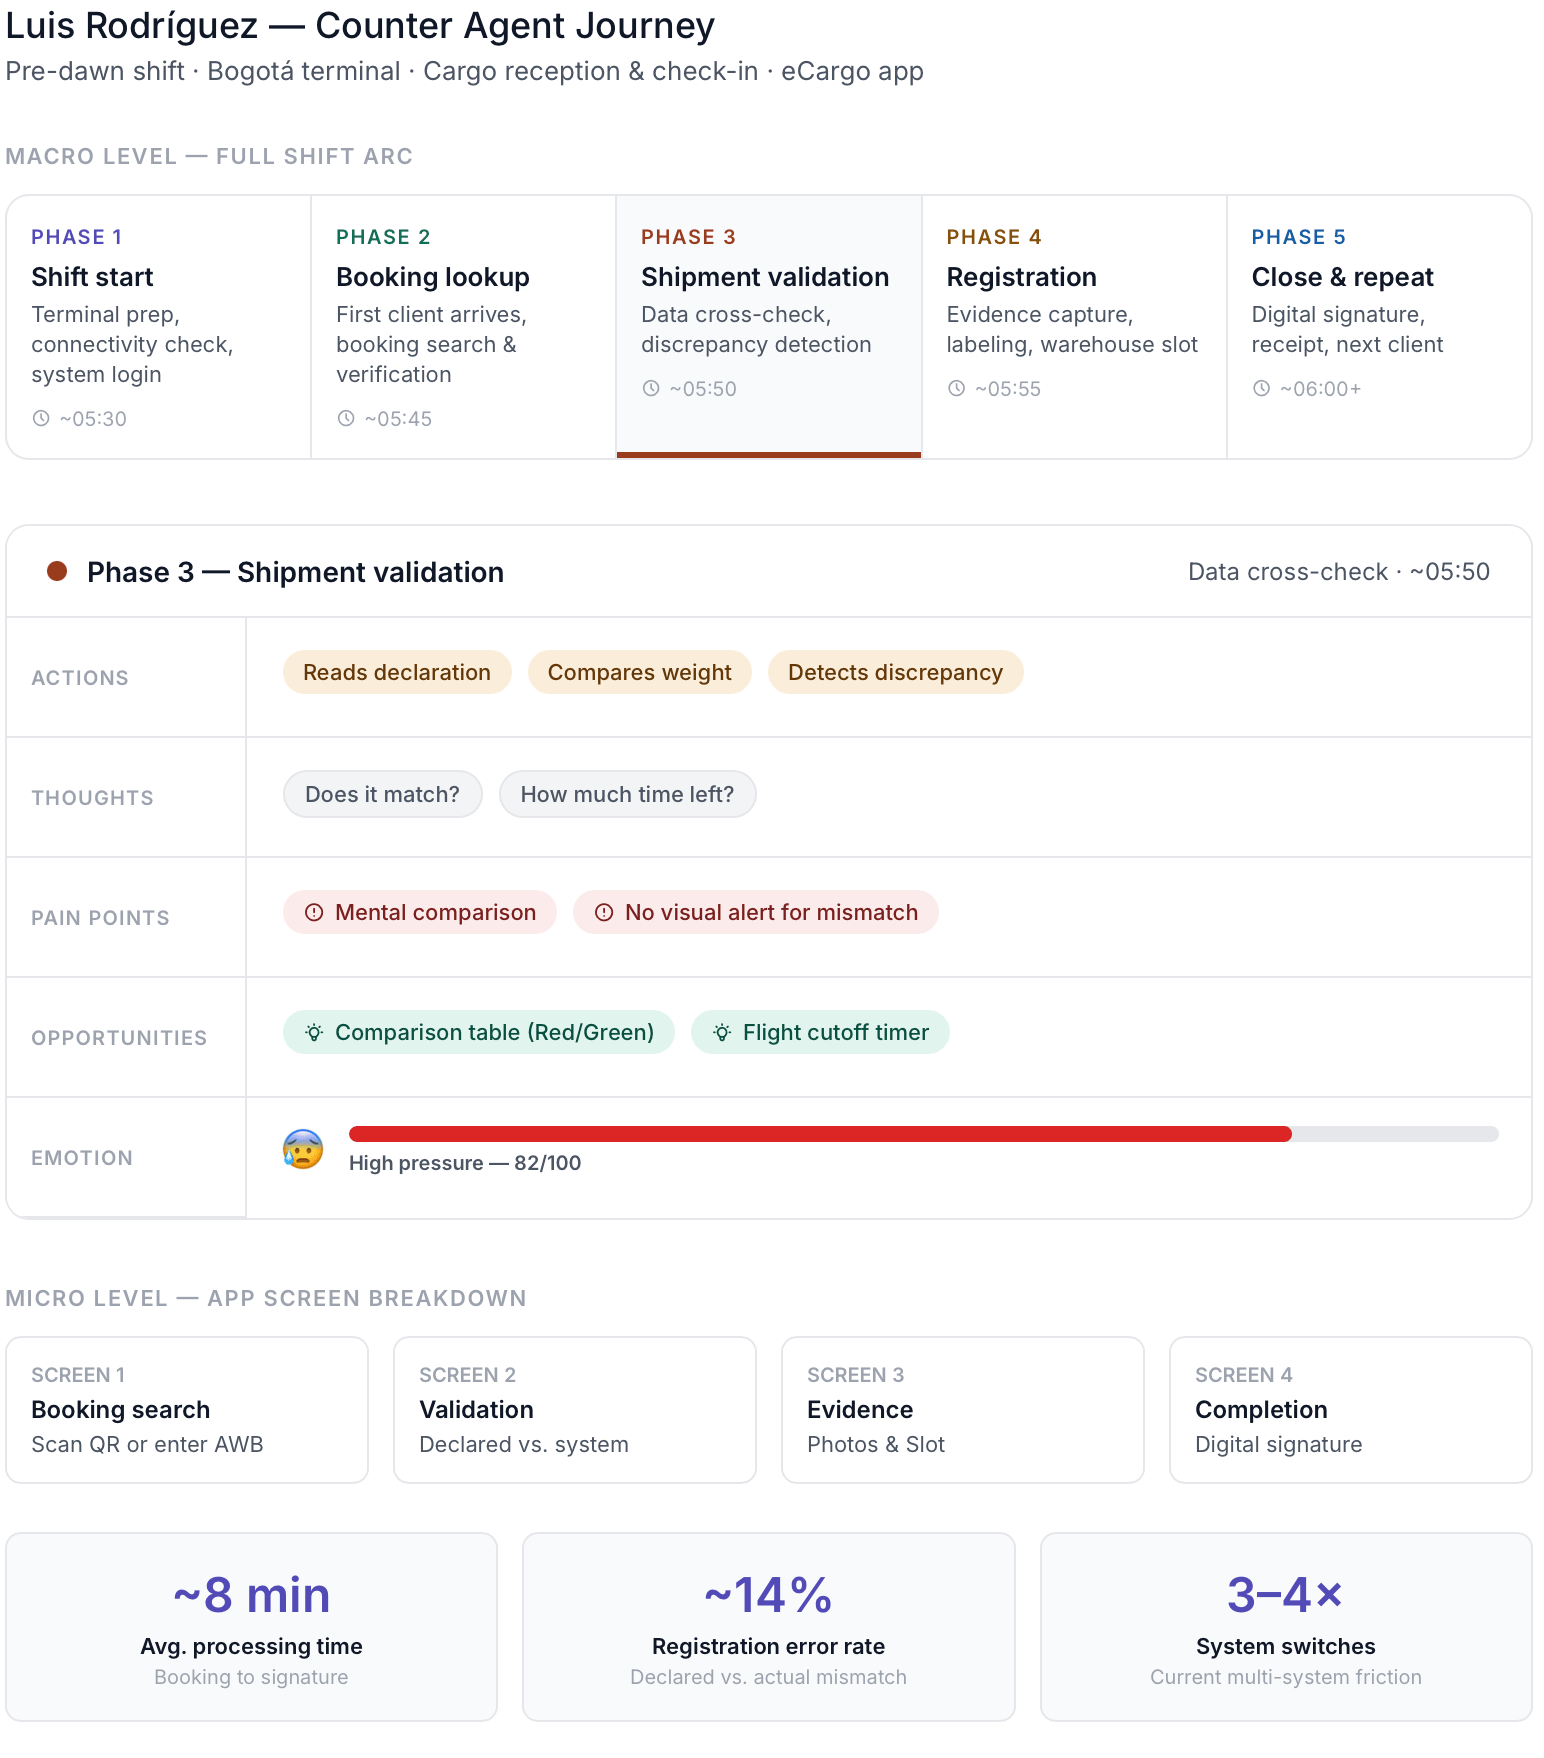
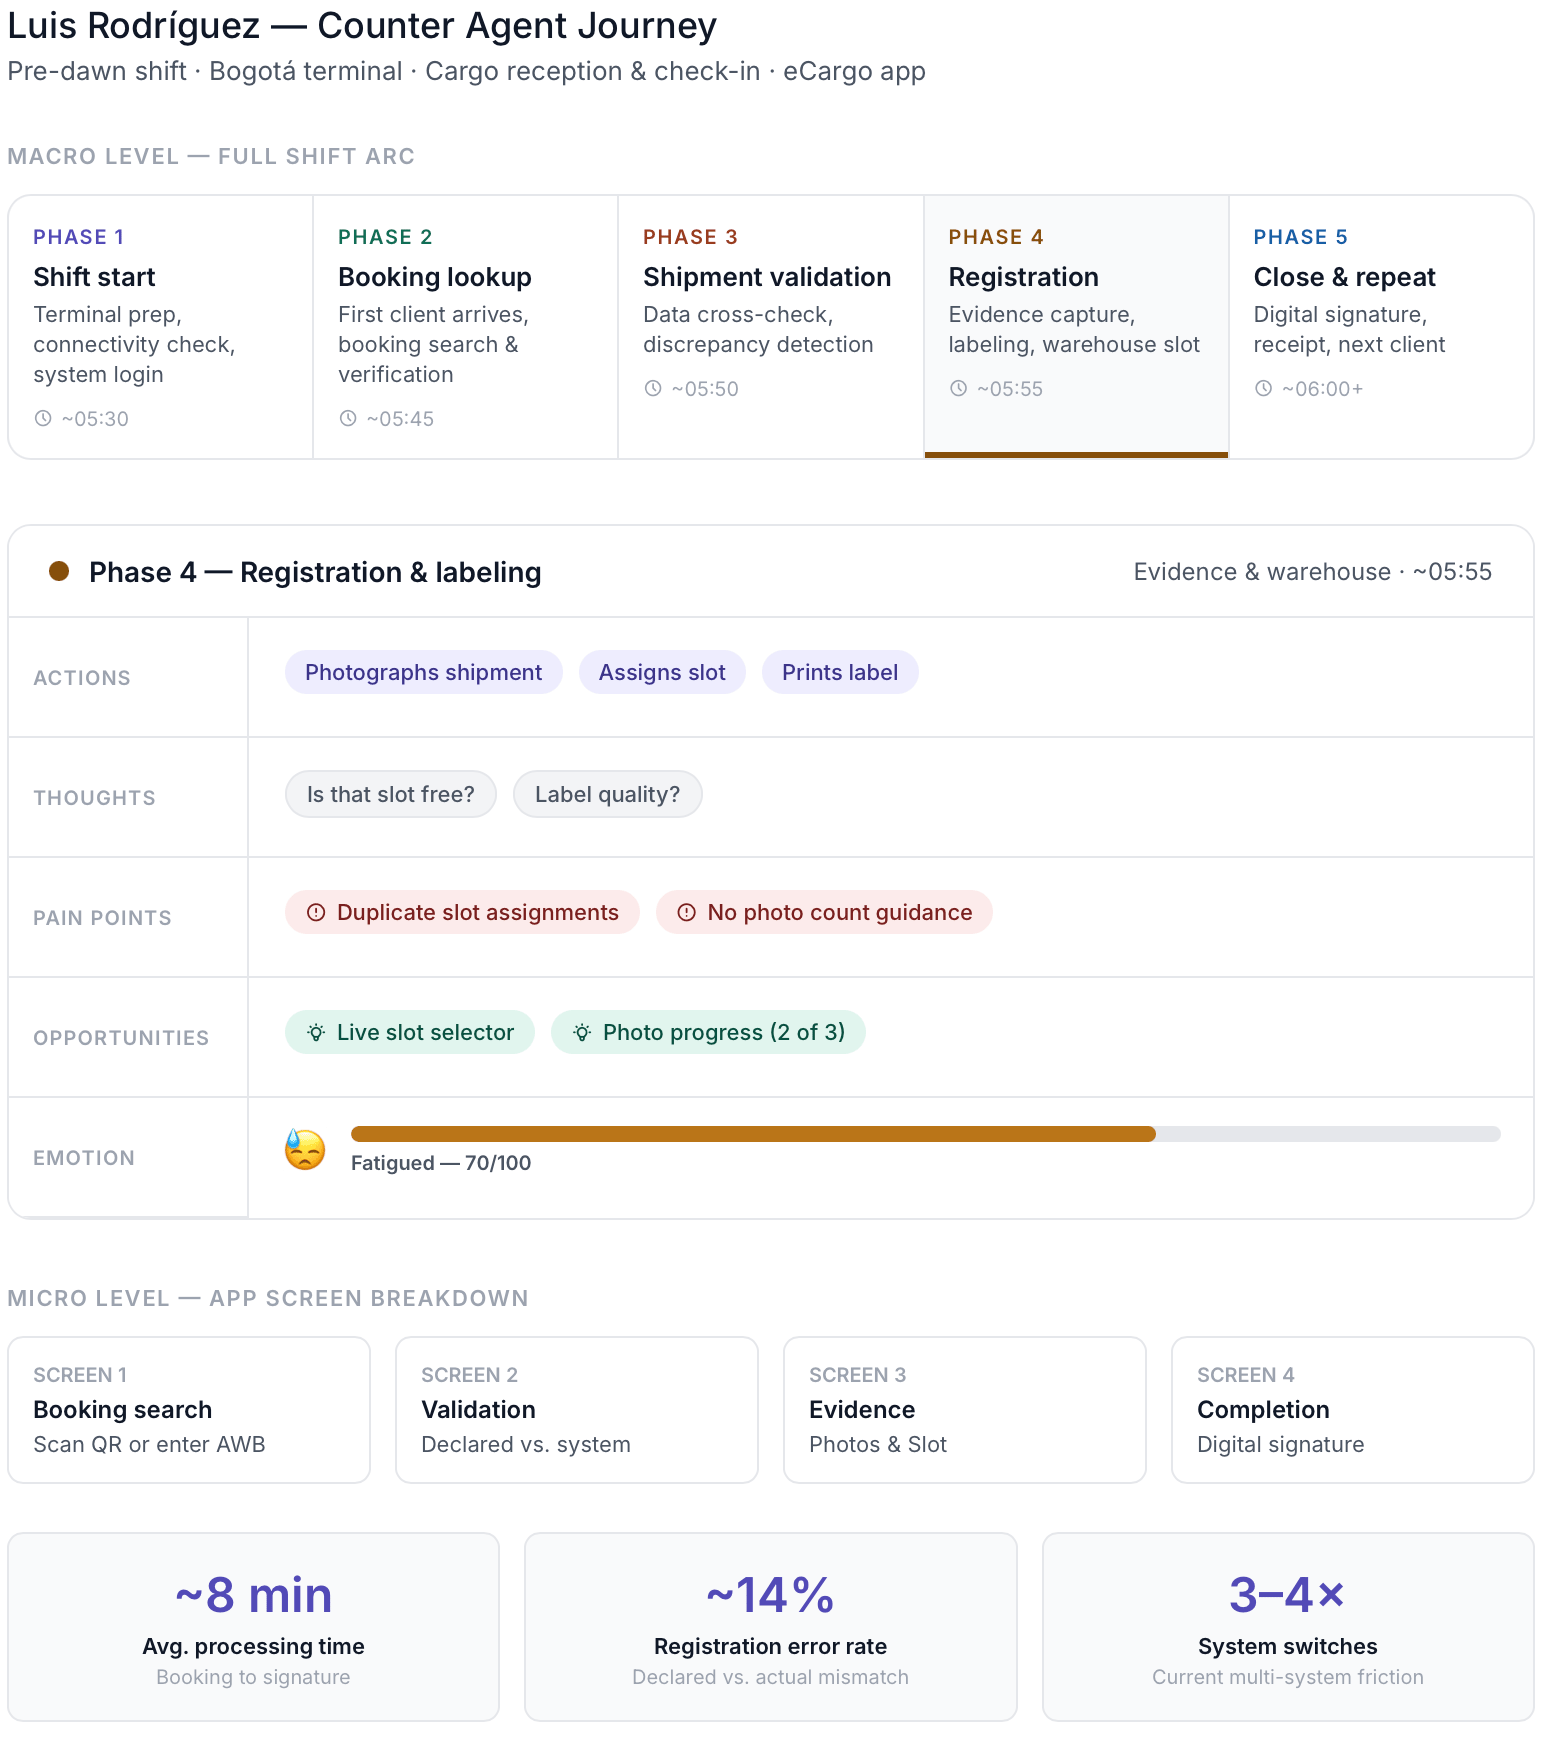
Luis, the representative counter agent persona, starts his shift before dawn processing incoming shipments. For each client arrival he must search a booking across multiple systems, manually verify that guide data matches declared information, register updates, assign warehouse locations, and collect client signatures, all under time pressure and with no unified tool supporting him. The main friction points were: consulting multiple systems per transaction, manually capturing data prone to transcription errors, and operating in a high-pressure, low-time environment that amplified the cost of every mistake.
Business Objective
Reduce average shipment processing time by 30%, registration error rate by 50%, and the number of flights with counter-attributable incidents by 30%. All within 90 days of implementation. Secondary objectives included reducing onboarding time for new agents, lowering post-implementation support tickets, and improving CSAT scores through reduced cognitive load and fewer downstream errors.
Product Owner & Business Request
The team identified counter agents as a critical but underserved touchpoint in the operational journey. The request was to design a digital tool that would replace fragmented manual processes with a unified, intuitive mobile experience, reducing systemic failure points while maintaining the speed and reliability the operation demands.
Applied Methodology
The project was structured across three phases.
Phase 1 focused on friction and opportunity investigation through contextual research: on-site shadowing during peak hours, post-shift semi-structured interviews, service blueprint mapping, customer journey mapping, and operational incident analysis.
Phase 2 translated those findings into a mobile prototype covering the full happy path, from QR-based booking verification through data validation, photo-based labeling, real time warehouse location assignment, and digital signature collection.
Phase 3 produced a structured usability testing brief with defined objectives, design hypotheses, natural-language tester tasks, success criteria with measurable thresholds, participant profiles, and a moderated testing recommendation, all anchored to the same business metrics defined at the start.
Key Data Points to Analyze - Phase 1
Systems
To understand the current state of the technological infrastructure supporting Luis's work, I will request access from the operations team to the systems the agent consults during each transaction, with the goal of mapping how many there are, what role each one plays, and at which point in the flow they are used. I will measure the error rate already internally recorded by the current system and the time elapsed between Luis entering data and the system confirming it. This information will allow me to build a real, not estimated technical baseline that I can then compare directly against the MVP's behavior to demonstrate measurable impact.
Business
To align the design with the company's operational objectives, I will work with the shift supervisor to digitize the manual cargo incident log he already maintains, turning that data into a trackable metric from day one. I will complement this by extracting from the system the number of weekly reprocesses, how many times a record was corrected after being confirmed and the average processing time per shipment using the start and close timestamps the system already captures. These three indicators will serve as the business anchor of the project: without them, there is no way to demonstrate that the redesign generated real value beyond perceived experience.
Operational Metrics
To understand how the flow behaves under real pressure conditions, I will document the full average processing time per shipment, from booking lookup to client signature, and the error rate in registration by comparing declared weight and dimensions against actual measurements. I will cross-reference the counter check-in closing time with each flight's warehouse delivery deadline, allowing me to precisely measure the frequency of delays directly attributable to the reception process. Finally, I will analyze transaction volume per shift and its hourly distribution, with a particular focus on how Luis and his colleagues absorb peak load periods, because that is exactly where the design needs to hold up most.
Friction & Opportunity Analysis - Phase 2
Contextual Research
I will conduct on-site shadowing sessions alongside him and other counter agents during full shifts, with deliberate priority given to peak hours. I will observe without intervening, because the gap between what people describe in an interview and what they actually do under pressure is where the most critical design insights live.
This will allow me to capture workarounds, micro-decisions, and coping mechanisms that would never surface in a formal session. Following each shift, I will run semi-structured interviews post-turno to understand which steps generate the most friction from the agent's own perspective, which errors recur most frequently, and what informal solutions they have invented to compensate for the limitations of the current process.
Shadowing is the priority method here precisely because Luis operates under time pressure and cognitive load, what he declares in an interview is a reconstruction, not a live account.
Complementary Research
I will build a service blueprint of the current flow mapping all systems, internal and external actors, handoff points, and breakdown moments across the full counter reception process. This artifact will make visible not only where Luis struggles, but where the system itself creates conditions for failure independent of user behavior.
Alongside this, I will construct a customer journey map focused on Luis's experience to identify which pain points the digital solution can directly mitigate and which ones it cannot resolve but still influence business metrics a distinction that is critical for setting honest expectations with stakeholders. Finally, I will analyze support tickets and operational incidents reported by the operations team, which will provide a quantitative layer to validate what I observe qualitatively in the field and help prioritize which friction points carry the highest operational cost.
Why This Combination?
No single research method tells the full story. Shadowing reveals behavior, interviews reveal reasoning, the service blueprint reveals systemic structure, and ticket analysis reveals frequency and severity.
Together they create a triangulated foundation that prevents designing solutions for symptoms rather than root causes, and they establish the before state that will make the impact of the MVP measurable and credible when the time comes to present results to the business.
Success Metrics - Phase 3
Business Metrics
The success of this project will be measured against three hard business targets, all evaluated within a 90-day window post-implementation.
First, a 30% reduction in average processing time per shipment from the moment Luis searches the booking to the moment the client signs, directly impacting the operation's capacity to handle higher volumes without adding headcount.
Second, a 50% reduction in the registration error rate, measured by comparing declared weight and dimensions against actual values at the time of reception, which cascades directly into fewer reprocesses and fewer post-confirmation corrections in the system.
Third, a 30% reduction in flights with incidents attributable to the counter stage, tracked by crossing incident logs per shift against flight departure records translating design decisions into cargo integrity and on-time performance outcomes that the business already tracks and cares about.
Business-Aligned, Operationally Grounded
Beyond the immediate operational targets, the design is expected to generate compounding value across three additional dimensions. A more intuitive tool means new agents reach autonomous operation faster, reducing the training overhead that every counter turnover currently generates.
Fewer system errors and clearer guided flows mean fewer post-implementation support tickets, which lowers operational support costs and reduces service interruptions. These metrics connect the micro-level UX decisions made in the design to macro-level service quality indicators the business already monitors.
From my perspective...
What I'm specifically contributing to this research phase goes beyond mapping pain points. I'm building the measurement architecture before a single screen is designed defining which data needs to be captured now, how to extract it from existing systems, and what the baseline looks like, so that when the MVP ships, we're not guessing whether it worked.
Most design projects in operational contexts fail to demonstrate impact not because the design was wrong, but because no one set up the before state with enough rigor to make the after state meaningful.
That is the gap I'm closing here: treating metric definition as a design deliverable, not an afterthought.
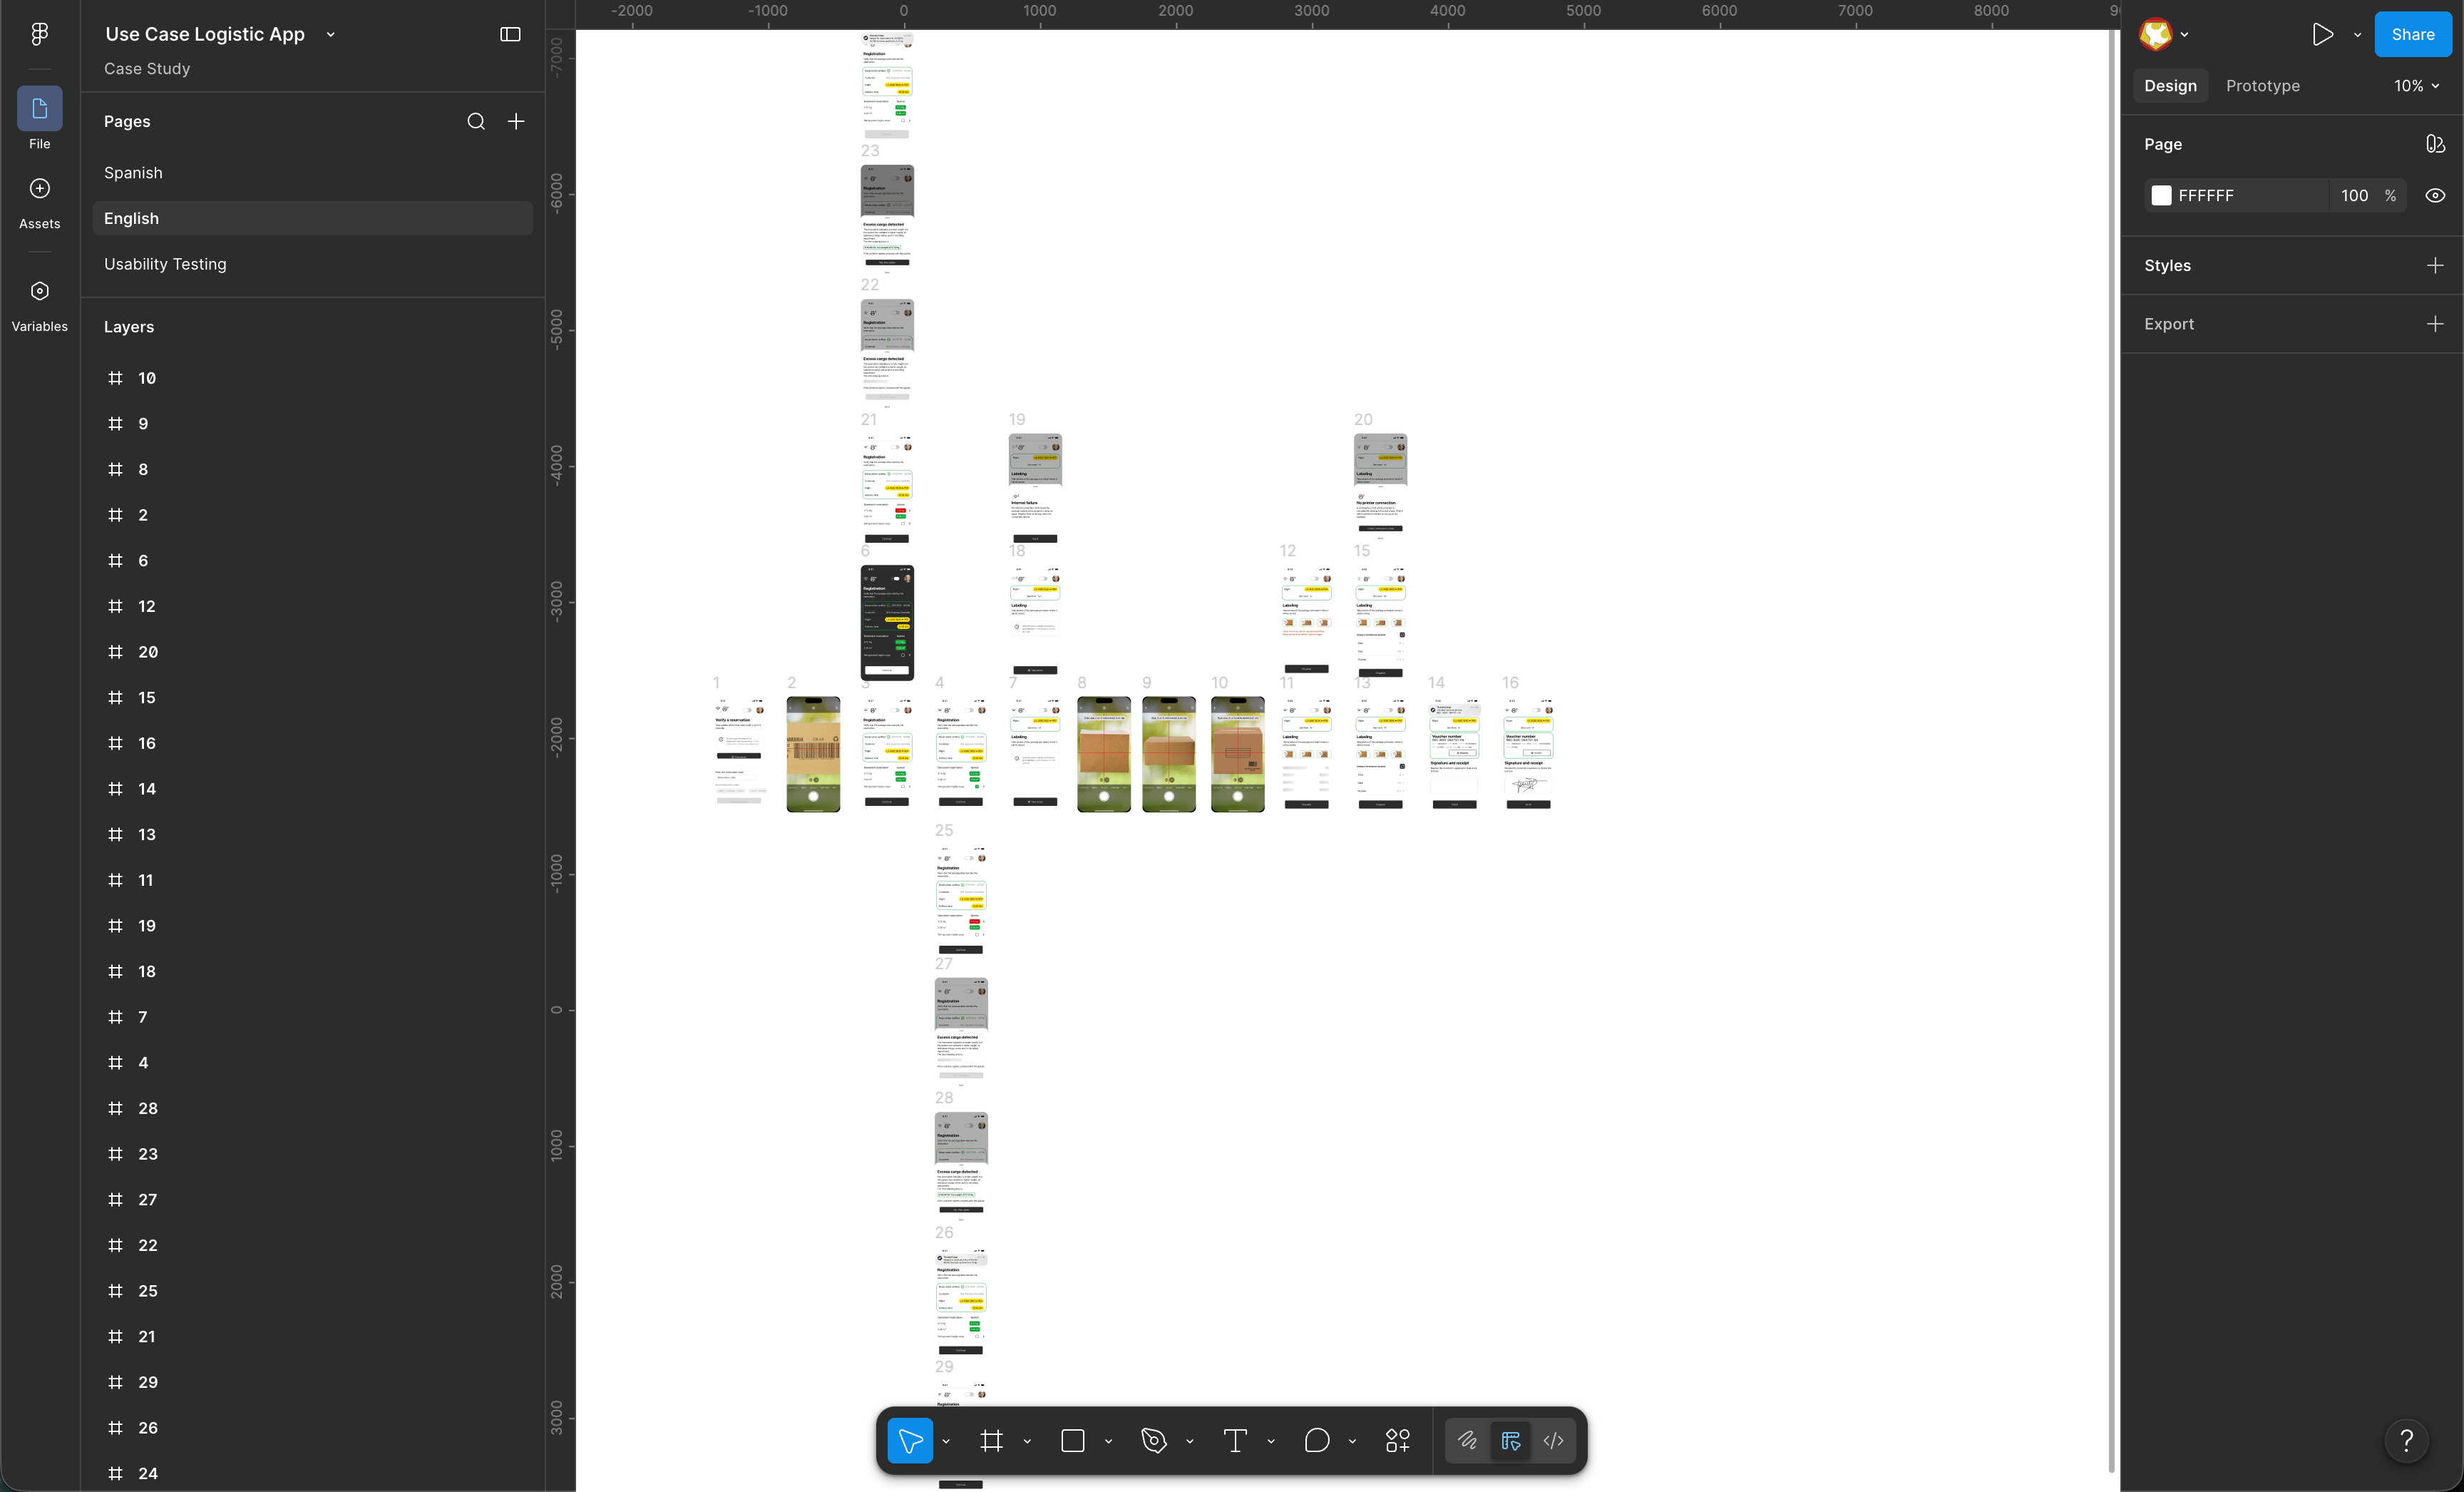
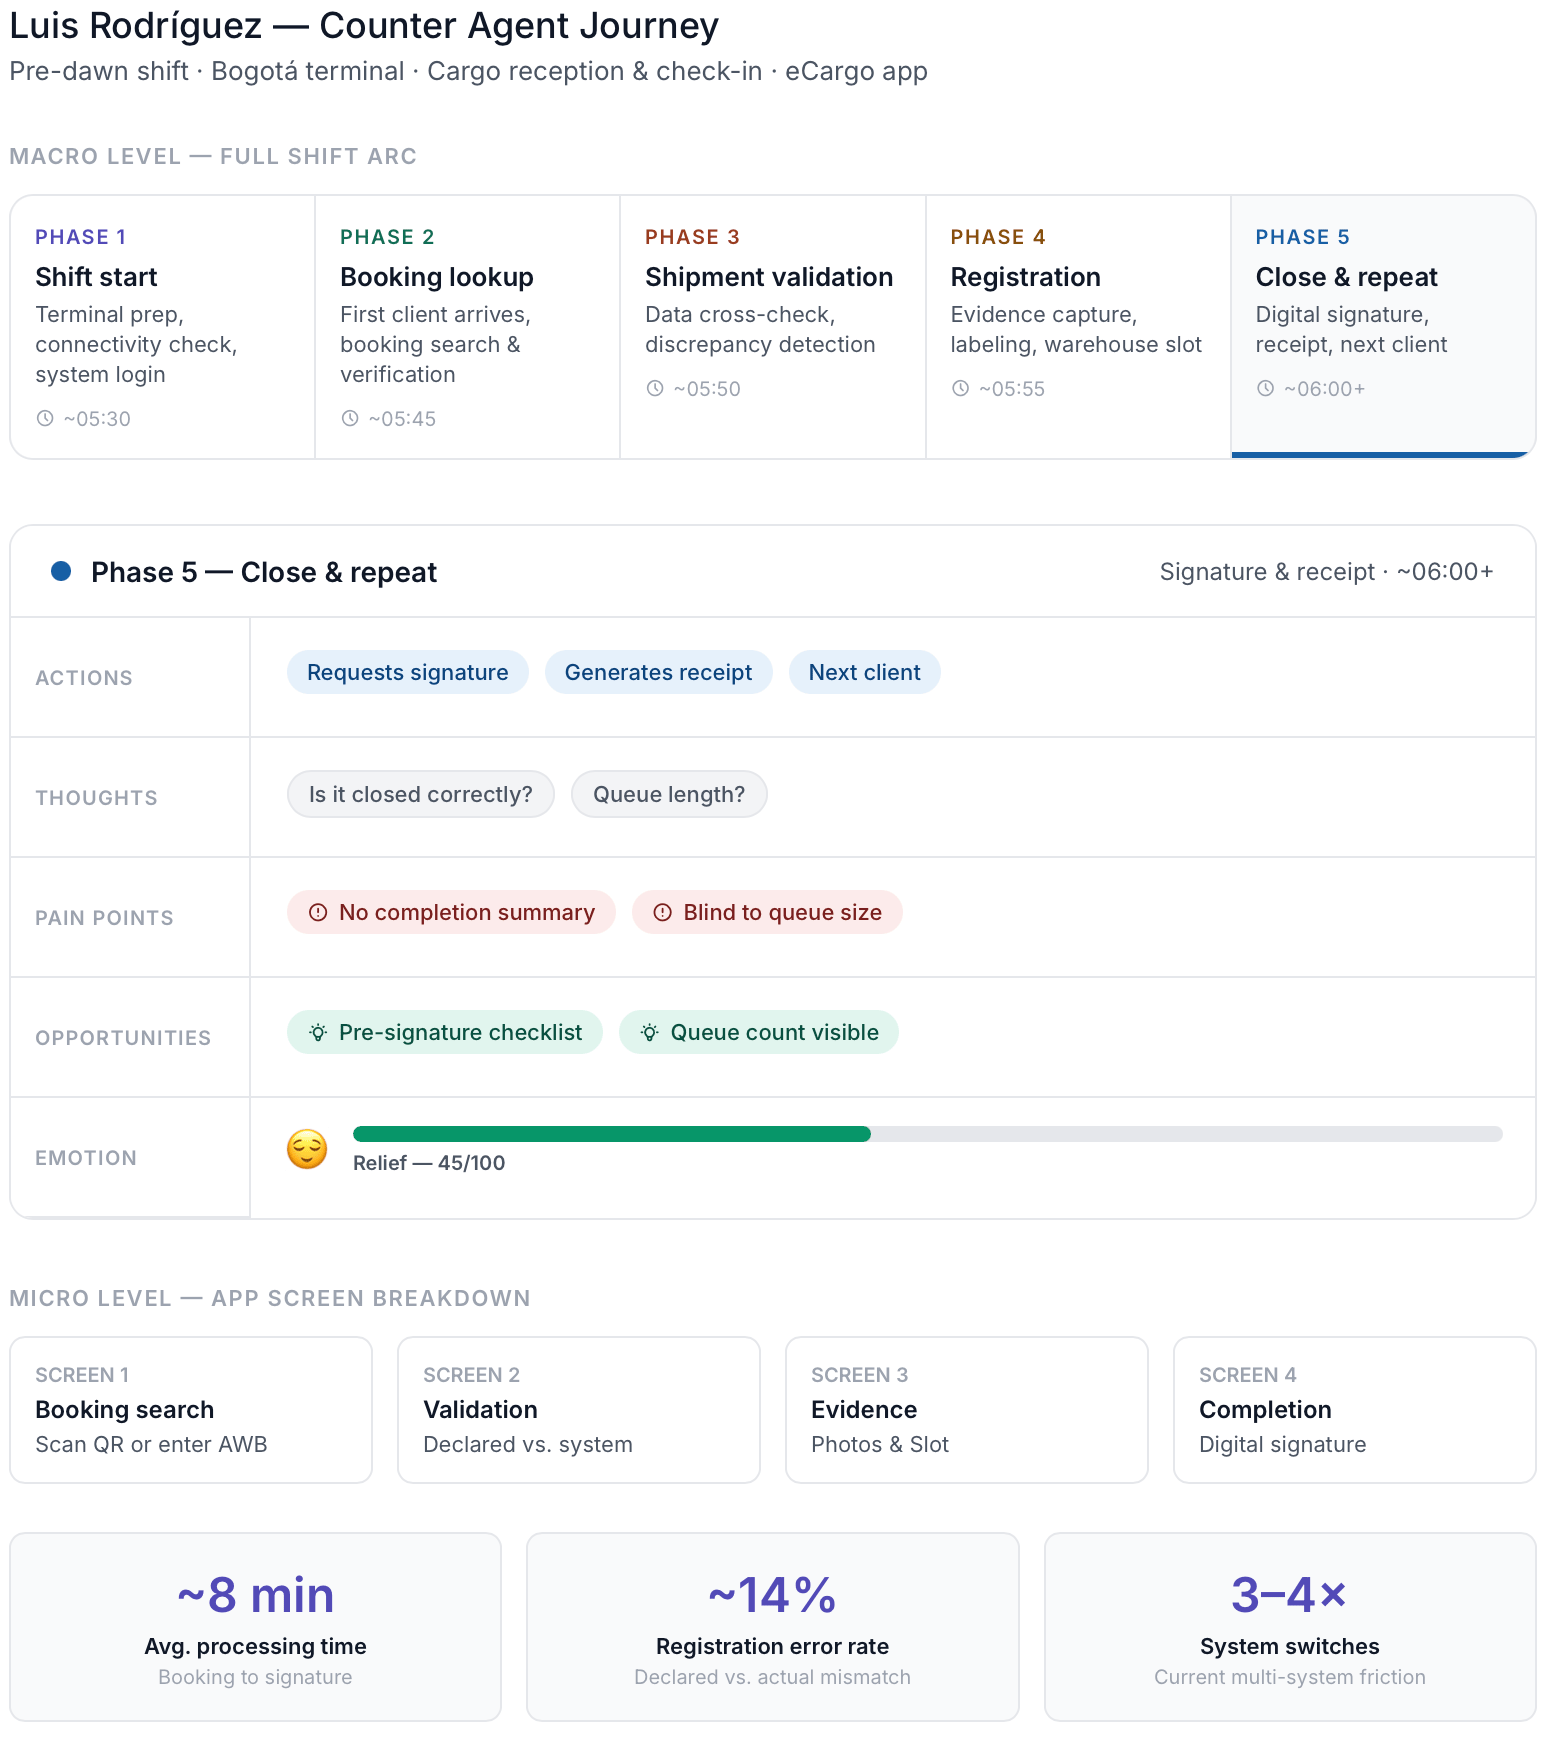
User Journey Map
Explore the prototype